Insights & News

Renewable Power Market in Chile, June 2022
Based on information provided by Chile’s National Electric Coordinator, information on the renewable power market is provided below.
During the last 12 months, the amount of energy from renewable sources, particularly solar and wind power, has continued to increase.
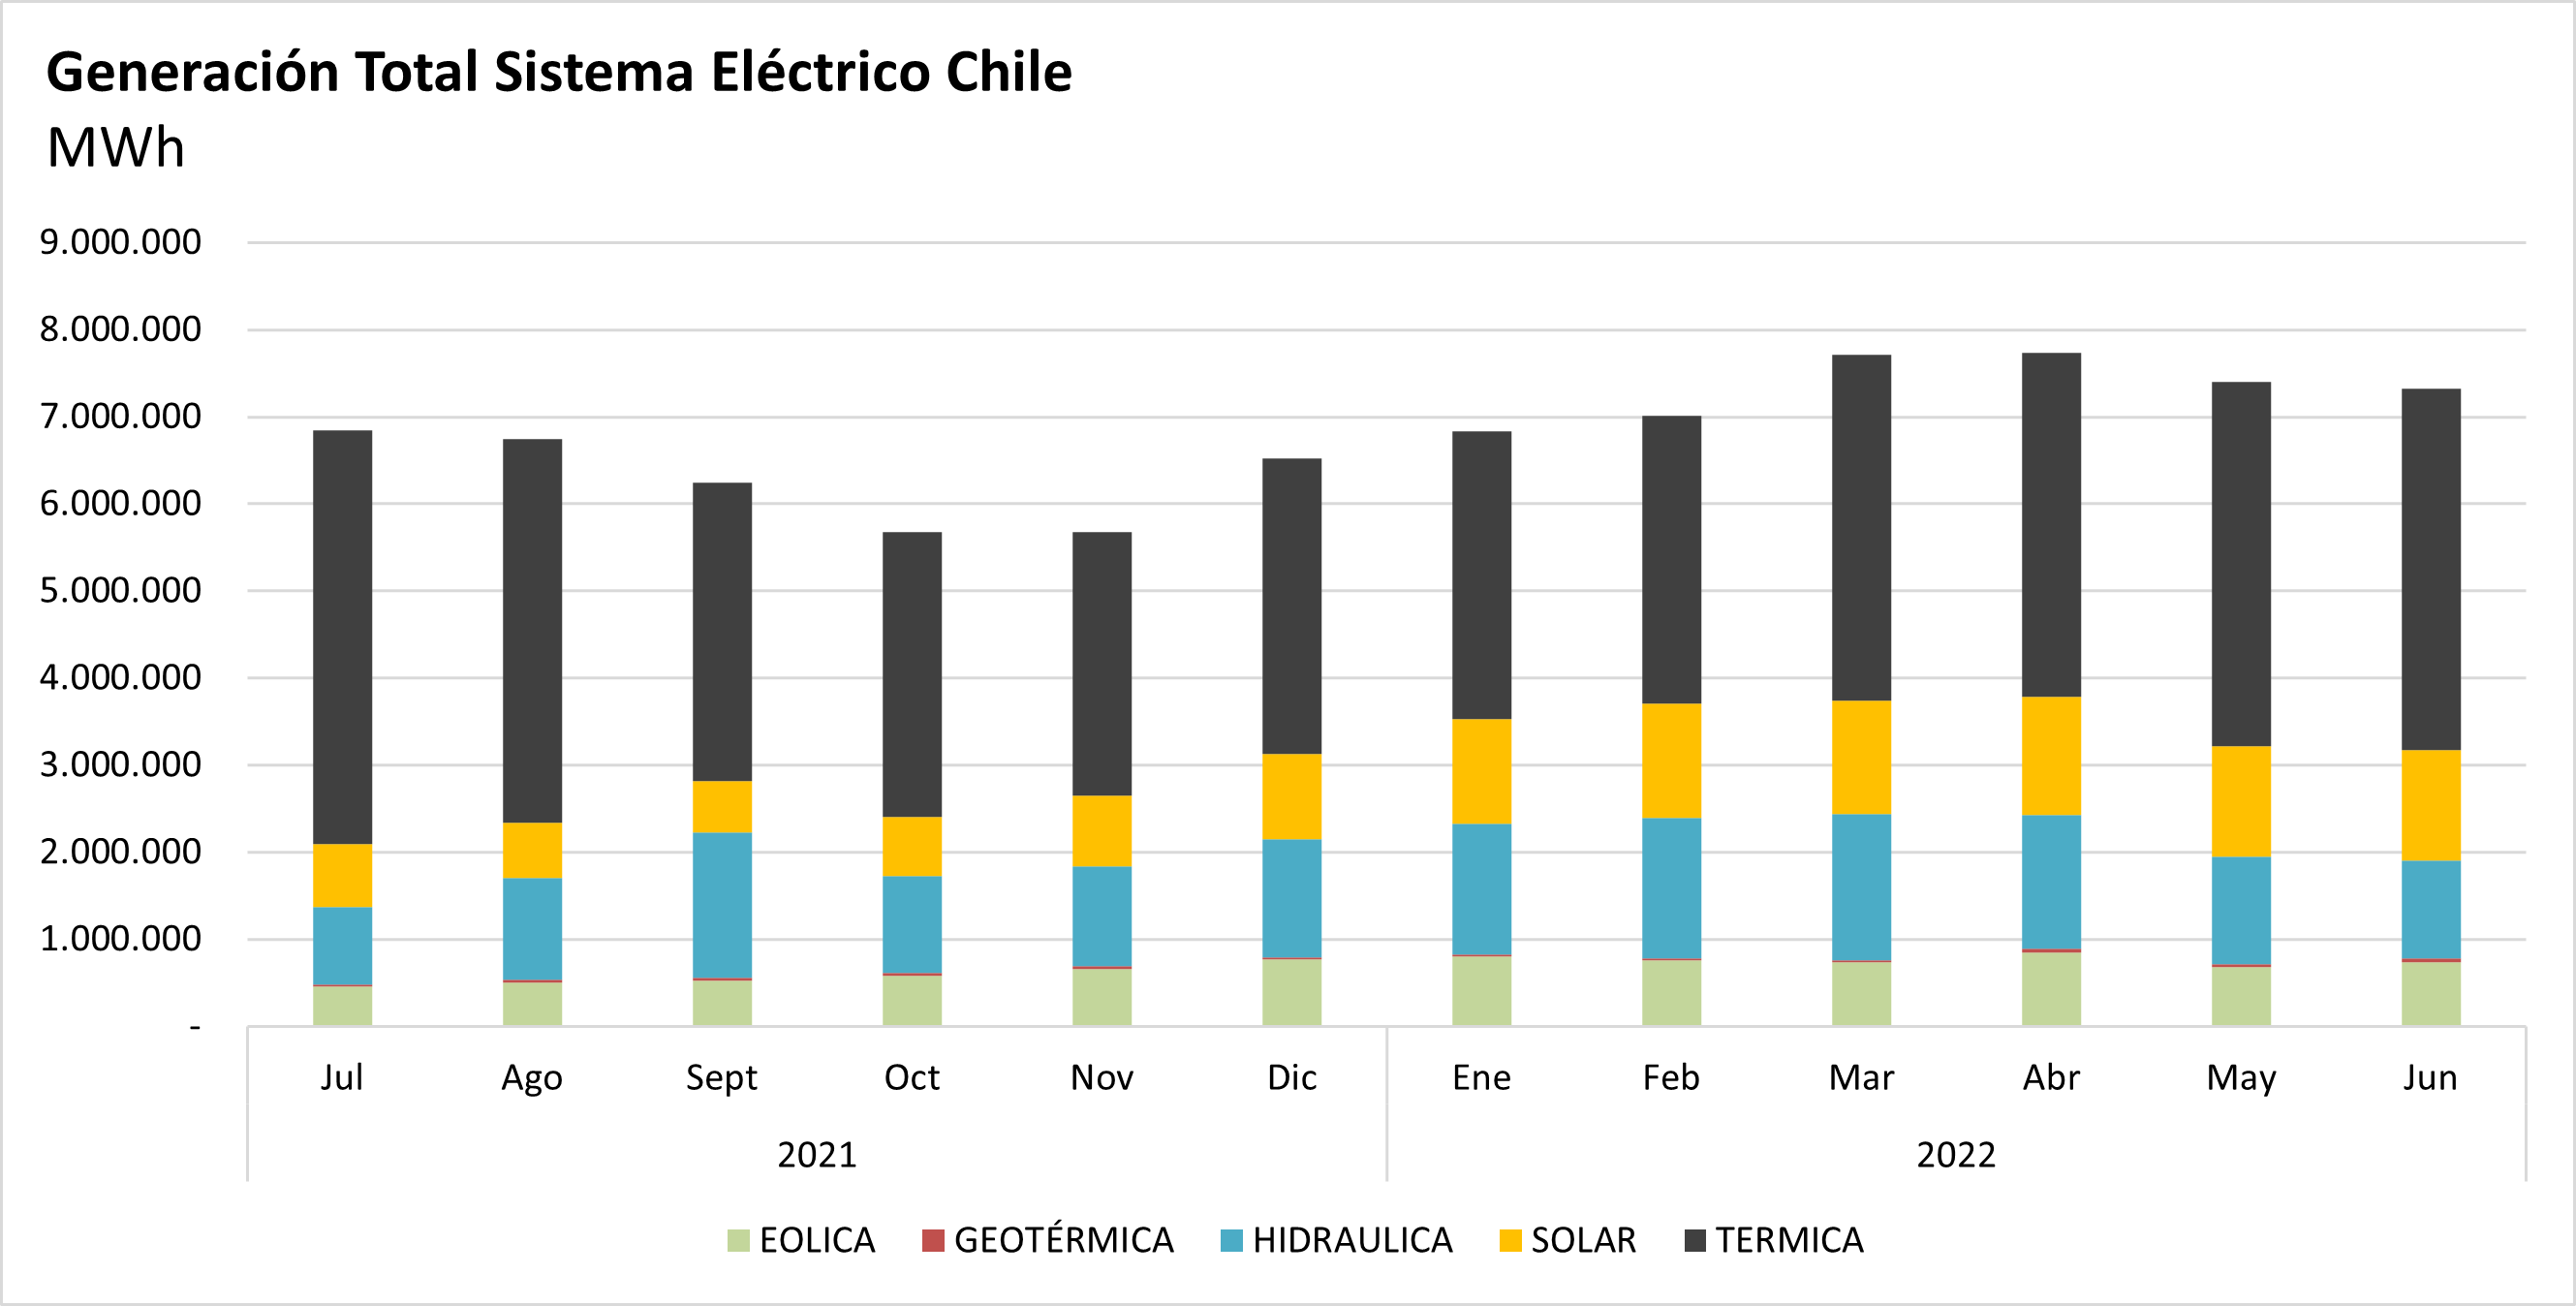
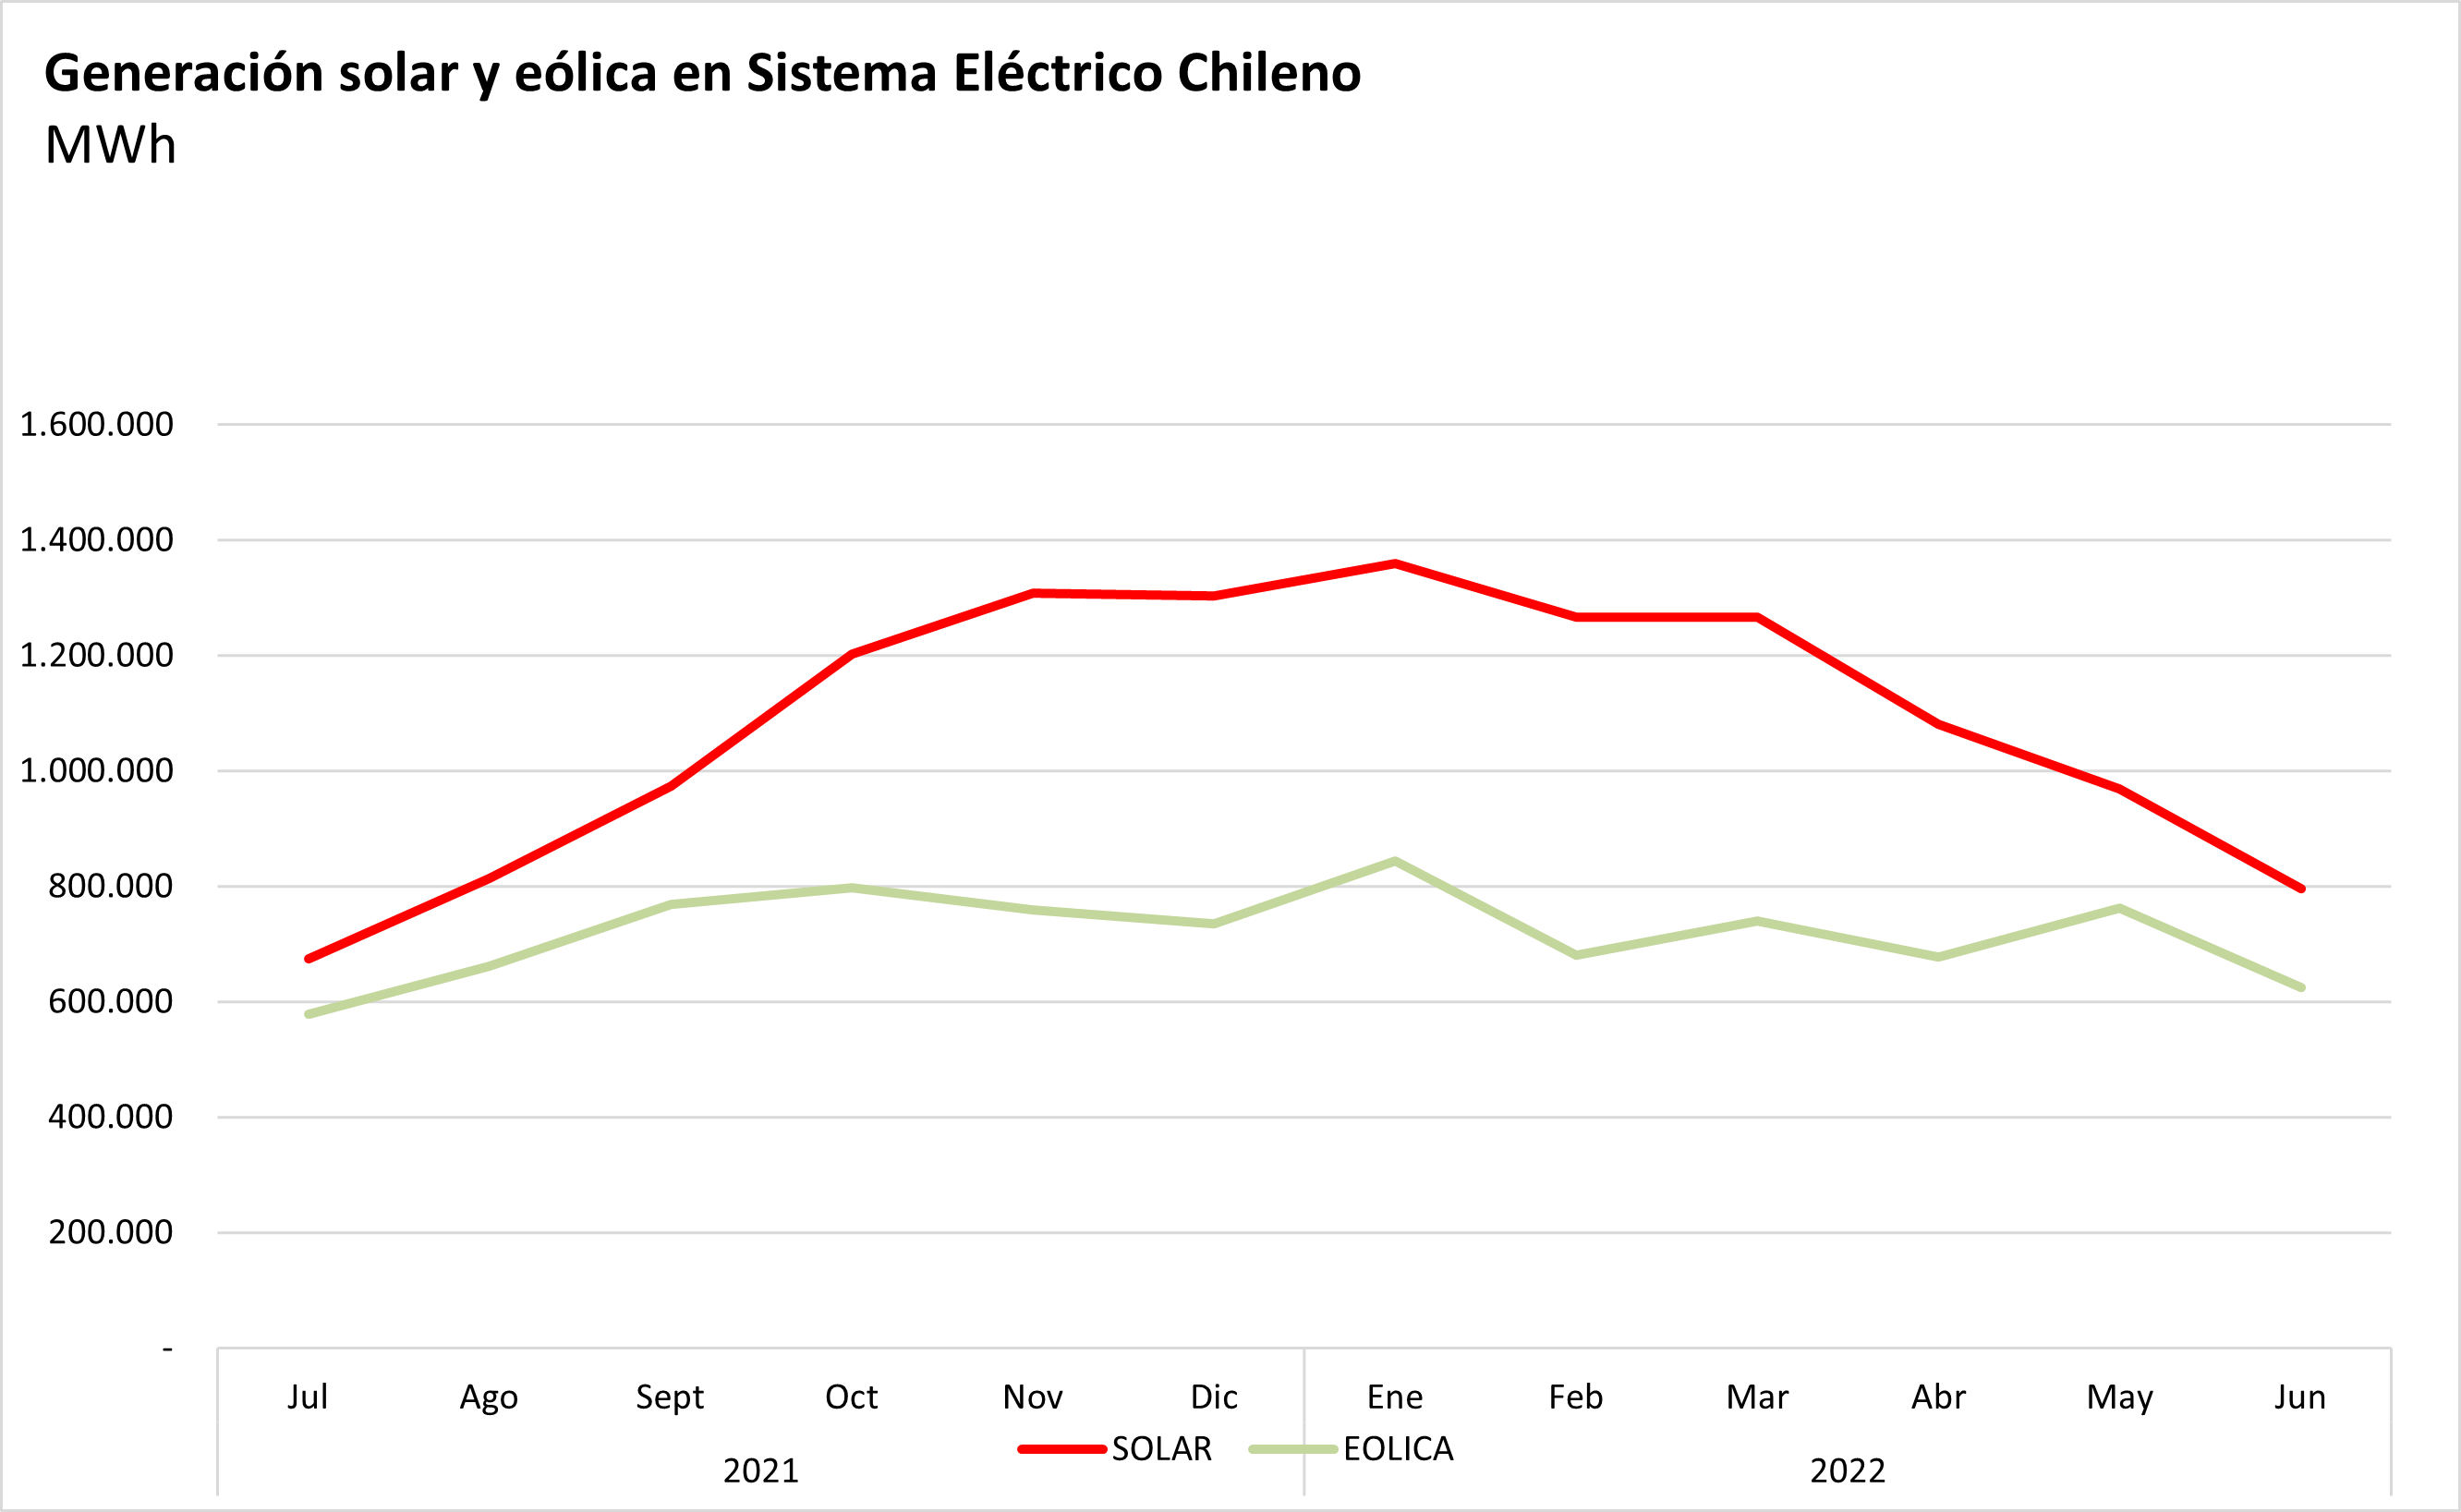
During June 2022, solar power generated 35% (795,680 MWh) more than in June 2021 (591,533 MWh), and wind power generated 18% (624,880 MWh) more than in the same month of the previous year (529,924 MWh). On the other hand, generation from thermal sources increased by 5% this month compared to the same month of the previous year. Total generation in June 2022 was 4% higher than in June 2021.
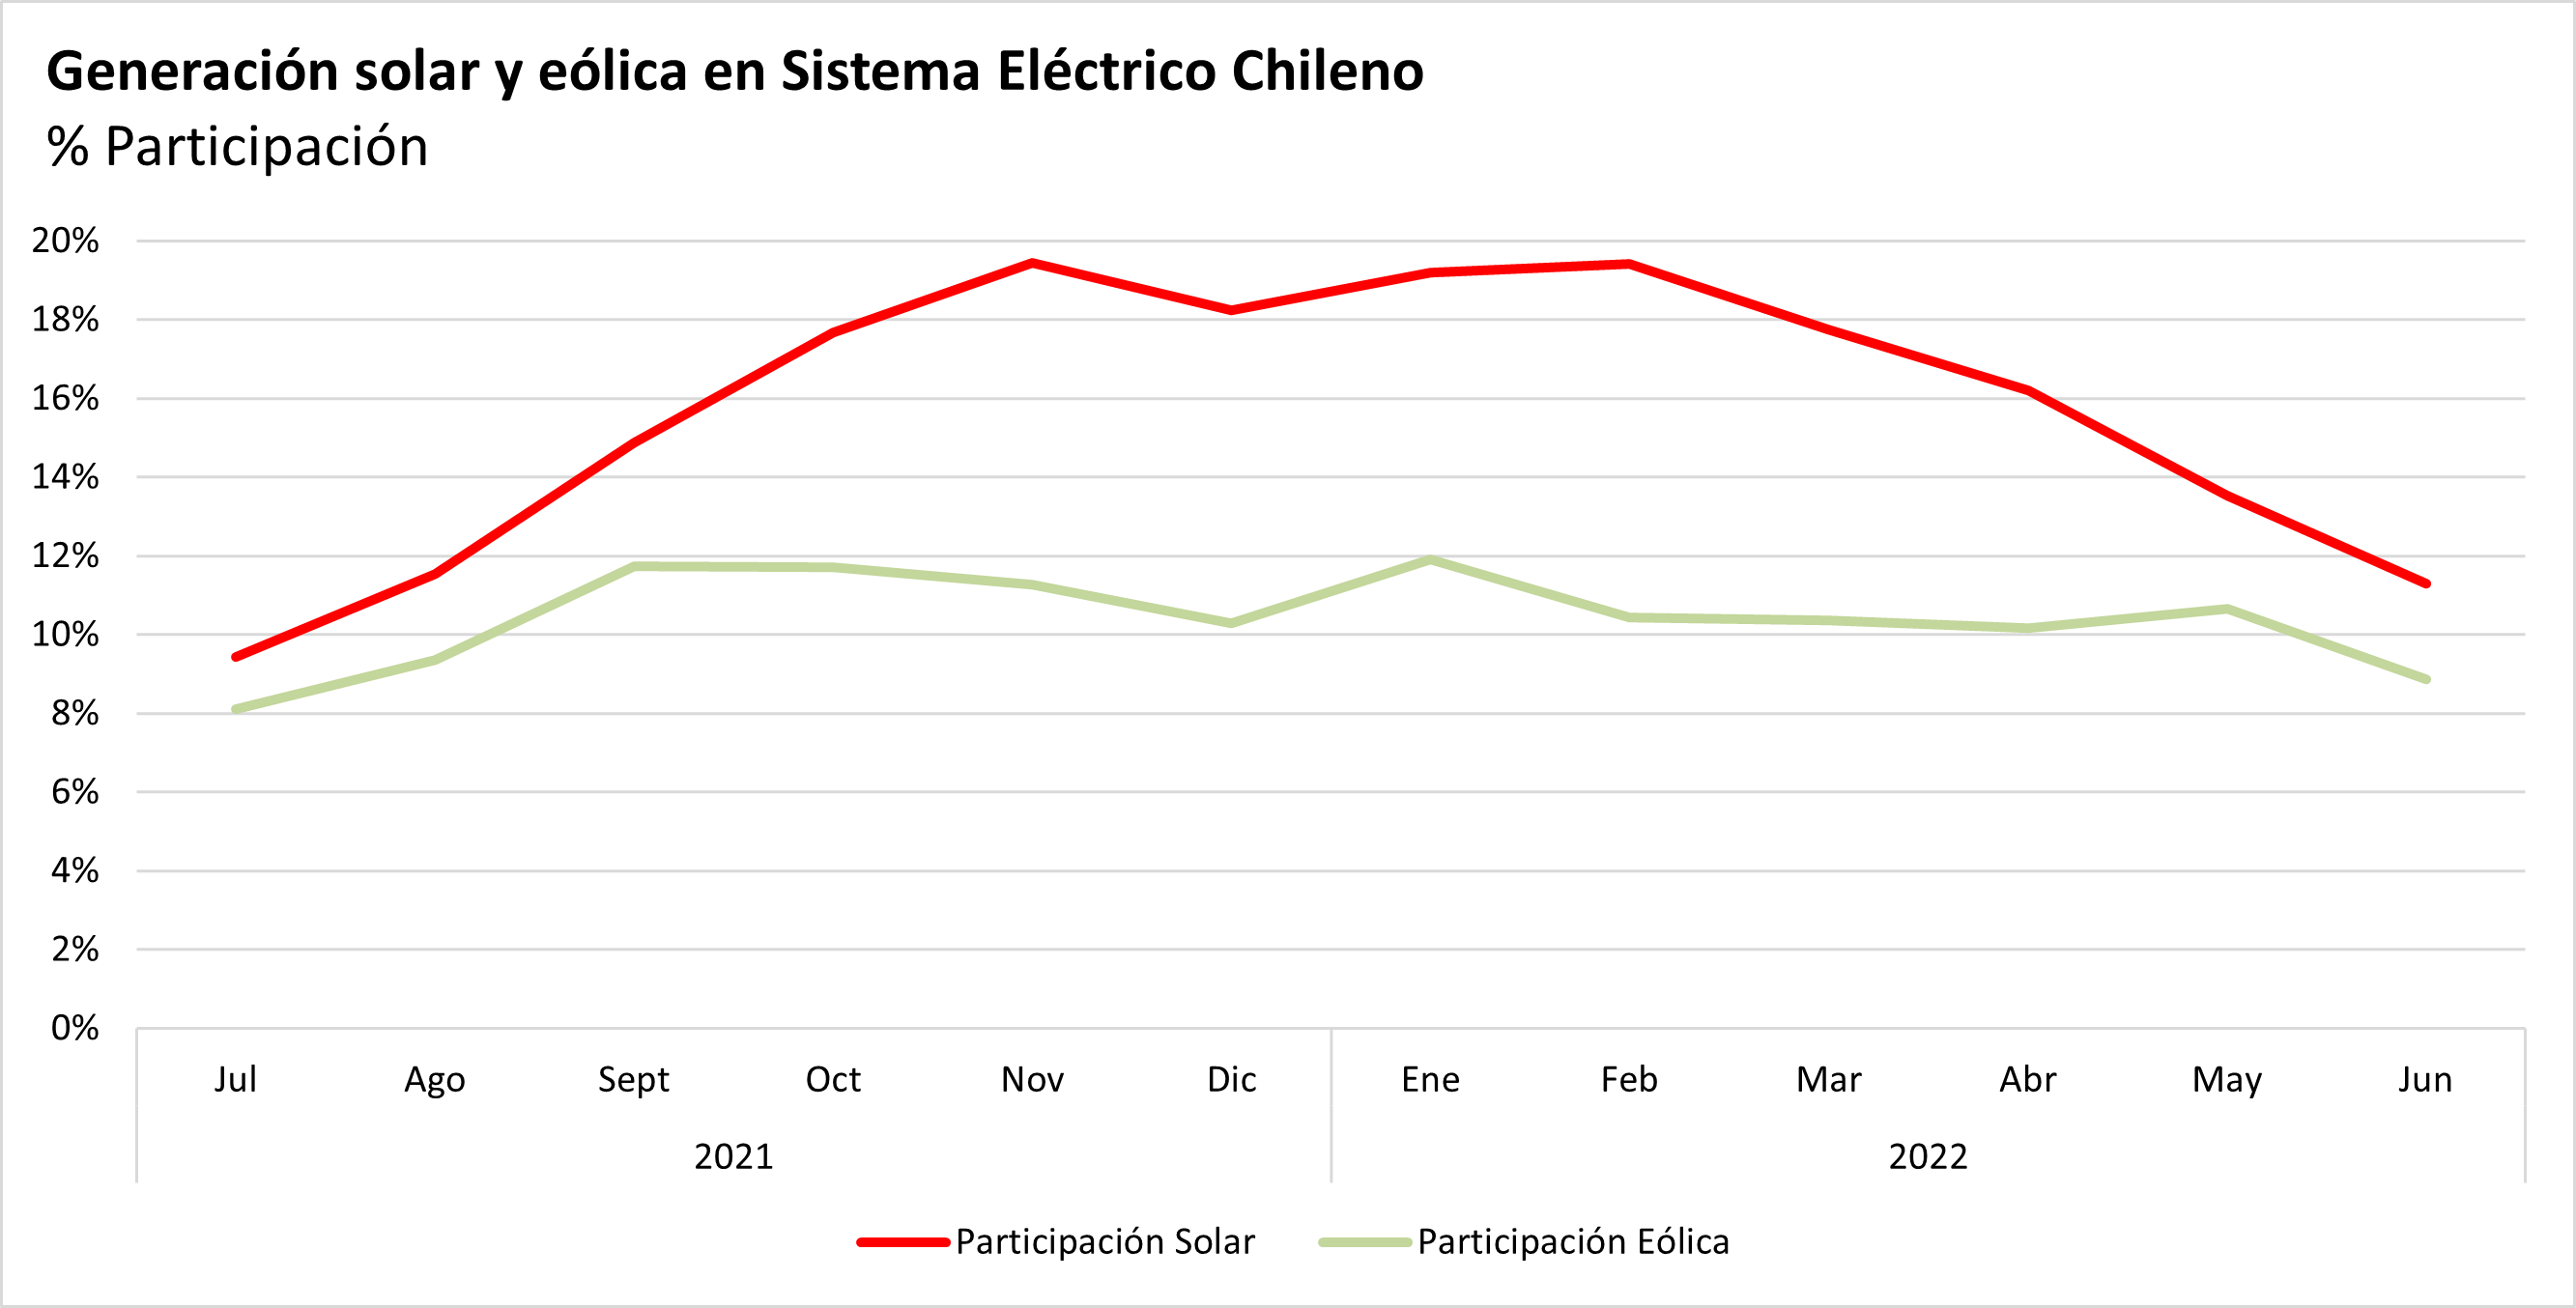
If we analyze in detail the solar and wind generation during the last 12 months, the total generated and its share in Chile’s generation market has increased, as shown in Graphs 2 and 3. In June 2022, solar power generated had a 11% share of the national total, while 12 months ago this share was close to 9%.
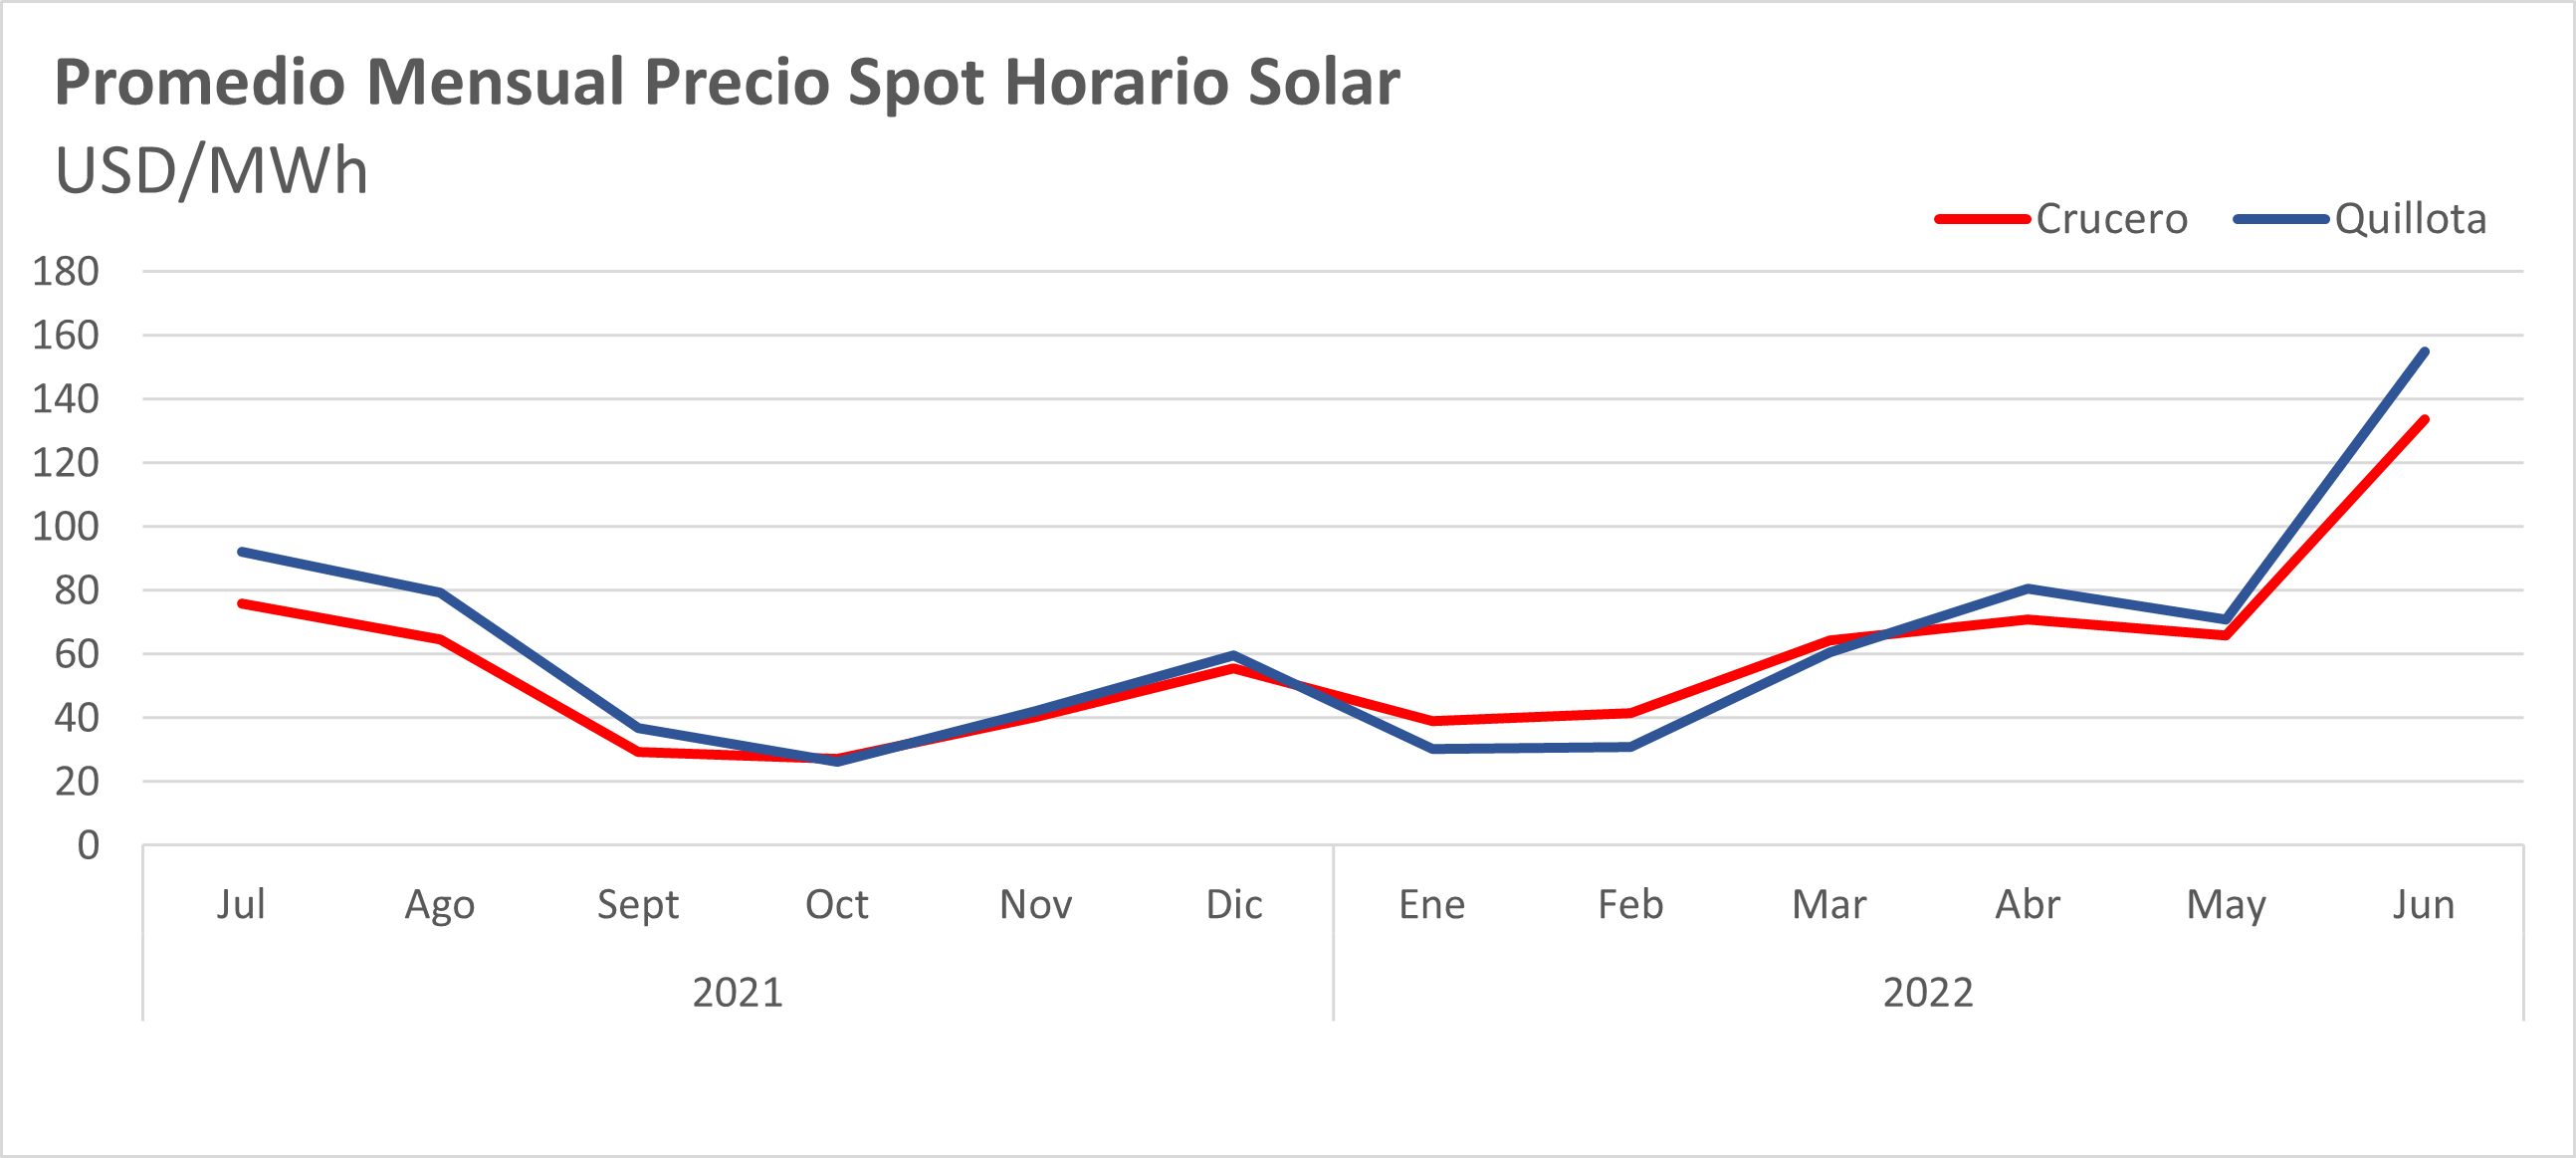
On the other hand, Graph 4 shows the evolution of energy prices throughout Chile. During 2020, the average price was approximately 40 USD/MWh, while for the last 12 months this value is approximately 114 USD/MWh.
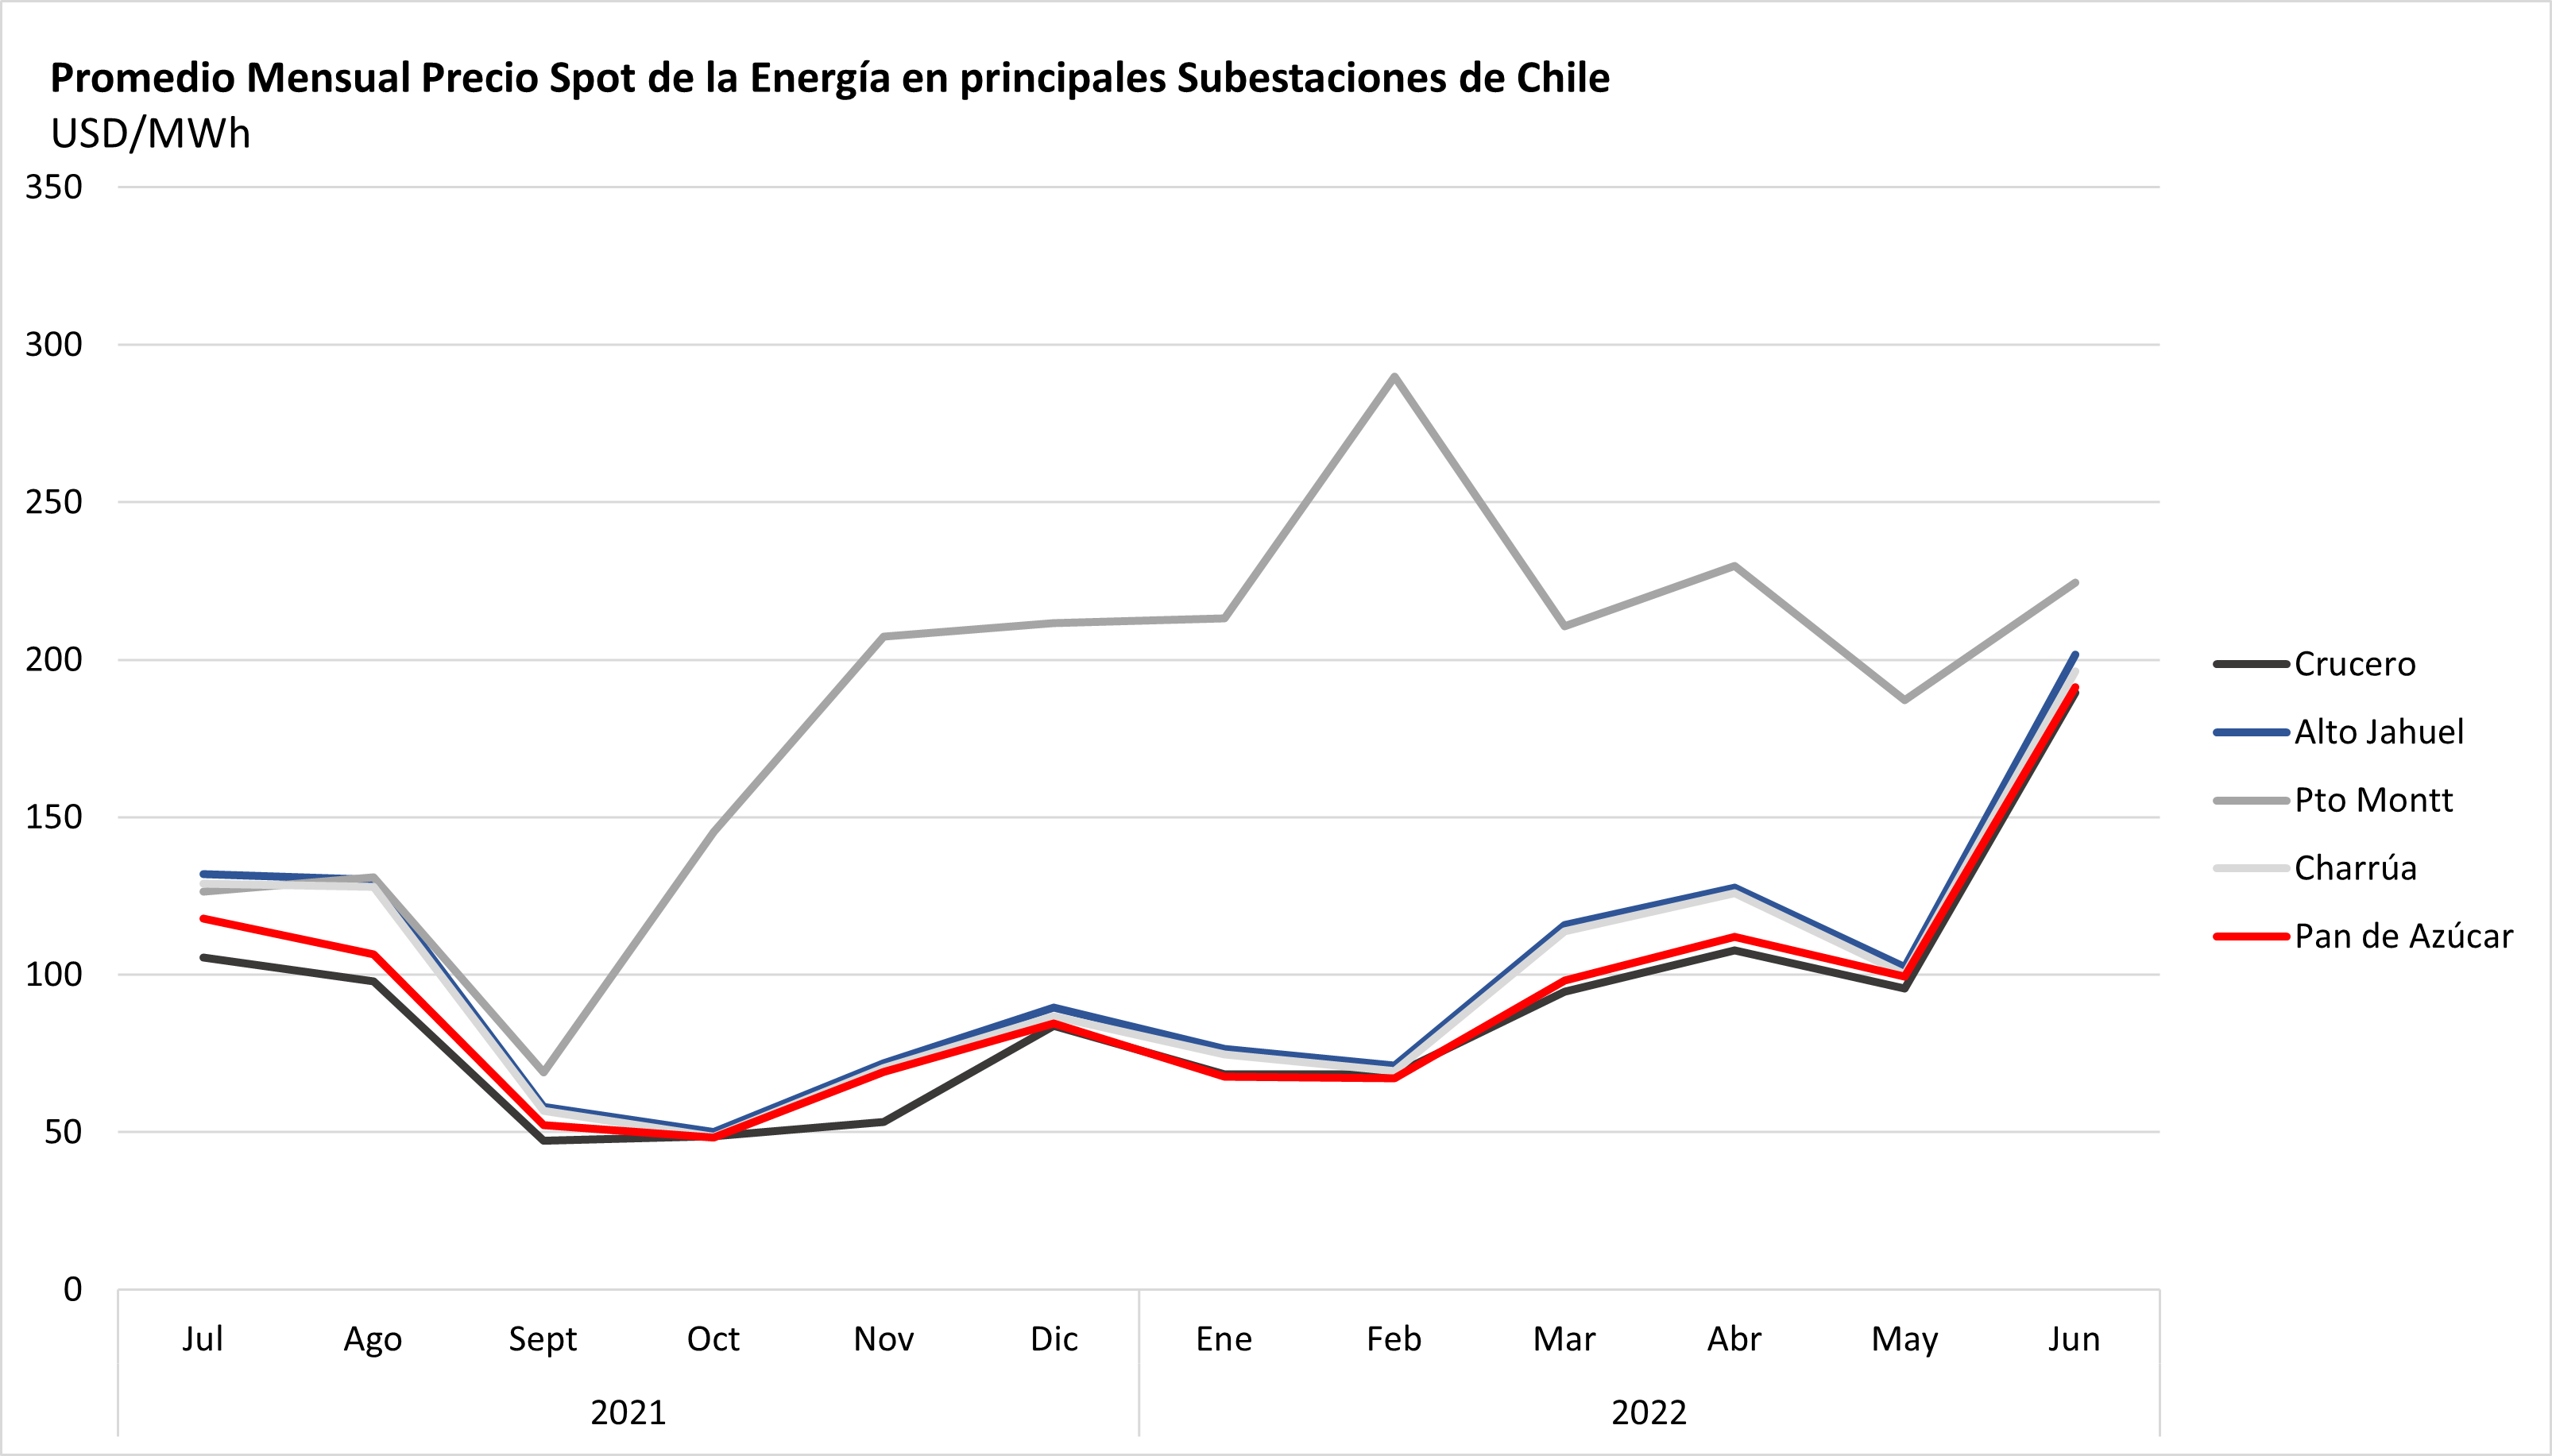
For solar hours, considered between 8:00 and 18:00 hrs, the average price during 2021 was approximately 49 USD/MWh at Crucero substation (Northern Chile) and 58 USD/MWh at Quillota substation (Central Chile). During 2020 these values were 32 and 34 USD/MWh respectively for each substation. In June, the price was between 155 and 134 USD/MWh in Quillota and Crucero respectively.